Publications
Backed By Science
Explore the independent, peer-reviewed science behind Green Atlas. Discover how leading agricultural research institutions worldwide validate and utilise Cartographer to optimise orchard management in horticultural crops.
Journal Articles
Relationships between canopy radiation interception and LiDAR-derived geometry features in pome and stone fruit
Scalisi, A., O'Connell, M., Peavey, M., McClymont, L., Goodwin, I.
Acta Horticulturae, 2024
applespeachespearsnectarinesplumsapricotscanopy geometrylight interception
Show AbstractSolar radiation is a fundamental resource for the productivity of horticultural crops. Traditional methods to measure fractional canopy radiation interception (fPARi) rely on the use of ceptometers or light trolleys. Advances in light detection and ranging (LiDAR) sensing suggest that this technology can be used to estimate fPARi in orchards. This study aimed to establish relationships between LiDAR-derived estimates of canopy geometry obtained with the commercial platform Cartographer (Green Atlas) and fPARi in apple, pear, peach, nectarine, plum and apricot and to assess the underlying effects of orchard characteristics such as crop, canopy design, row orientation, row spacing and tree density. The study was carried out in the experimental orchards of the Tatura SmartFarm over 2021-22 and 2022-23. Among the parameters obtained with Cartographer, cross-sectional leaf area (CSLA) had the most robust relationship with fPARi. N-S oriented apple tree canopies intercepted 14, 17 and 23% more radiation per unit of CSLA than NW-SE, NE-SW and E-W canopies, respectively. Fractional cross-sectional leaf area (fCSLA), defined as the ratio between CSLA and the product of row spacing and canopy height, could be used as a simple predictor of fPARi, although the relationship was not very robust - i.e., coefficient of determination (R2) and root mean square error (RMSE) equal to 0.62 and 0.06, respectively. A substantial improvement of fPARi prediction (R2=0.94 and RMSE=0.03) was achieved with a multiple regression model that used CSLA, canopy height, crop, tree age, canopy design and row orientation as predictors. Overall, the technology used in this study was successfully used for accurate estimates of fPARi.
![First page of The use of predictive technology to estimate yield from flower counts in high density almond (Prunus dulcis [Mill.] D.A. Webb) orchards](https://greenatlas.com/processed_images/2024-almond-flower-counts-yield.ac9dd0bd9943bd7f.jpg)
The use of predictive technology to estimate yield from flower counts in high density almond (Prunus dulcis [Mill.] D.A. Webb) orchards
Coetzee, Z., Scalisi, A., Underwood, J., Morton, P., Scheding, S., Goodwin, I.
Acta Horticulturae, 2024
almondsyield estimationblossom counts
Show AbstractThe Australian almond industry has increased 17-fold between 2000 and 2022 with over 60,000 ha in plantings. Accurate seasonal yield prediction is necessary to assist in resource management, especially tree nitrogen demand, and aid in harvest logistics. To enable timely nitrogen management, accurate yield predictions need to be done early in the growing season. The ability to predict crop size from flower counts will assist in early season nitrogen application adjustments. Technology has rapidly increased in the capability to capture and analyse large data sets to assist in orchard management decisions and increase horticulture productivity. The ground-based platform Cartographer (Green Atlas) utilises RGB cameras, LiDAR and GPS to accurately determine tree attributes like flower counts as well as tree geometry at a commercial scale. The study was conducted on the Mildura SmartFarm higher density planting – an experimental orchard consisting of 36 cultivar, rootstock and tree density treatment combinations. This work validated the use of the Cartographer machine vision system to accurately estimate the spatial distribution of flower counts in almonds. Predicted flower counts were ground truthed with manual flower counts and related to the measured yield.
Detecting, mapping and digitising canopy geometry, fruit number and peel colour in pear trees with different architecture
Scalisi, A., McClymont, L., Peavey, M., Morton, P., Scheding, S., Underwood, J., Goodwin, I.
Scientia Horticulturae, 2024
pearstrellis3D treesfruit colourblush estimationyield estimationcanopy geometry
Show AbstractIncreasing farm labour and input costs and the requirement for more orchard data are leading to rapid advances in technology to improve management systems in fruit production. The study aimed to (i) validate a sensorised platform to estimate fruit number, peel colour and blush coverage in pear orchards with different pear selections and tree architectures, (ii) establish relationships between fruit number, peel colour and canopy geometry features, and (iii) evaluate the platform for mapping and digitising orchard features. The study was carried out over two years in an experimental ‘ANP-0131′ orchard and in one year in two commercial pear orchards (‘ANP-0131′ and ‘PremP009’). Predictions of fruit number and blush coverage were compared in traditional three-dimensional (3D) and modern high-density two-dimensional (2D) training systems. Overall, prediction errors for fruit number were < 6.5 % in all the training systems, but improved performance was achieved in vertical 2D configurations (% standard errors = 2.2 %). Fruit number and blush coverage per unit of leaf area were higher in 2D compared to 3D training systems. Blush coverage predictions in ‘ANP-0131′ were reliable (R2 = 0.67, RMSE = 3.70 %). Accurate predictions of blush coverage classes were achieved by modifying sample variance. Fruit number and blush coverage were negatively affected by increasing canopy size. The platform proved useful for mapping and digitisation. Spatial heatmaps of orchard features provided a valuable visual aid to identify zones for priority interventions for peel colour enhancement.
A ground-based platform for estimates of fruit size in pear orchards – accuracy of block average, spatial variability and classification
Scalisi, A., McClymont, L., Morton, P., Scheding, S., Underwood, J., Goodwin, I.
Acta Horticulturae, 2024
pearsfruit sizefruit size distribution
Show AbstractThe pear industry would greatly benefit from obtaining orchard fruit size estimates and forecasts to inform logistics and the supply chain in advance. Measurements of fruit size in orchards are typically carried out with callipers on small samples. Promising technology available today has great potential to generate “Big Data” that can be used to maximise fruit growing efficiency and profit. This study evaluated the reliability of a commercial, sensorised, ground-based platform equipped with a network of proximal sensors – namely Green Atlas Cartographer – to estimate fruit size in pear orchards. The aim of the study was to measure the reliability of the predictions of fruit size and to evaluate spatial variability using orchard heatmaps. The study was conducted over the 2020-2021 and 2021-2022 seasons at the Tatura SmartFarm and in two commercial orchards in the Goulburn Valley, Victoria, Australia. Two cultivars were used for this experiment – the blush pear ‘ANP-0131’ and the uniformly dark red pear ‘PremP009’. In the first season, fruit diameter estimates on tagged fruit were compared to manual measurements of fruit equatorial diameter obtained with a digital calliper. In the second season, estimates of fruit size in detection zones (i.e., 6-10 m orchard row sections) were compared to fruit diameters obtained with digital callipers and with a commercial fruit grader. Fruit diameter prediction errors were consistently below 5 mm in both seasons. Remarkably, estimates of fruit size distribution classes showed errors below 2%. Early data on the expected fruit size at harvest has the potential to inform packhouses and the supply chain to direct the produce to the most profitable markets.
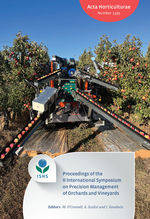
The use of the Cartographer (Green Atlas) for determining physiological changes in avocado trees and consequent timing of orchard management toward fruit robustness
McCauley, D., Patel, M., Stefanelli, D.
Acta Horticulturae, 2024
avocadoscanopy geometry
Show AbstractAvocado fruit robustness is a poorly defined parameter linked to fruit calcium content that describes how well an avocado fruit stands up to injury due to supply chain handling, supply chain temperature changes, and consumer handling. Early season predictions of future fruit robustness are currently not possible, therefore the evaluation of novel technologies for the prediction and management of fruit robustness has been initiated. Calcium has been shown to be a driver for fruit robustness in avocado, but its management is complicated as it is only available to the fruit for a short time after flowering and is controlled by multiple factors including transpiration, soil, root interactions with the soil, and particularly by the size of and growth of the tree canopy. The Green Atlas platform Cartographer is a fast mobile orchard scanning system that uses cameras and LiDAR to quantitatively measure canopy parameters such as leaf area, canopy density, and tree height. The Cartographer was used to measure ‘Hass’ avocado tree growth over three sites in Western Australia and was effective at identifying statistically relevant changes in tree growth over time for the above canopy parameters. With future calibration, changes in canopy growth of avocado trees, as measured by Cartographer, may be a fast non-destructive method of determining calcium absorption and fruit robustness and be a practical management tool for avocado producers.
A ground-based mobile platform to measure and map canopy thermal indices in a nectarine orchard
Scalisi, A., O'Connell, M., Whitfield, J., Underwood, J., Goodwin, I.
Acta Horticulturae, 2023
nectarinescanopy temperatureplant water status
Show AbstractPrecise irrigation management tailored to plant water status (PWS) is paramount to sustain agriculture in a climate change and water scarcity scenario. Canopy temperature (Tc), delta temperature [dT = Tc − ambient temperature (Ta)] and crop water stress index (CWSI) can be used to describe PWS. This study aimed to test a mobile platform sensor system (Green Atlas Cartographer equipped with infrared temperature sensors) for rapid measurements of Tc (and derivation of dT and CWSI) in a nectarine orchard. The study was conducted on mature high-density ‘September Bright’ nectarine trees under four irrigation treatments – 100% of crop evapotranspiration (ETc), 40% ETc, 20% ETc and no irrigation (0% ETc). The orchard was scanned using Cartographer to measure Tc. A local weather station was used to obtain Ta and derive dT, and two methods were used to calculate CWSI – a more traditional approach that used the relationship between dT and VPD (CWSI-I) and a statistical approach that used the 99% prediction intervals of the relationship between Tc and VPD (CWSI-II). Correlations of Tc, dT, CWSI-I and CWSI-II with leaf water potential (Ψleaf) and irrigation treatments were tested. Tc, dT, CWSI-I and CWSI-II were found to be significantly inversely related to Ψleaf and irrigation treatments when measurements were obtained between 1300 and 1915 h (AEDT) at different dates. CWSI-II outperformed CWSI-I in describing a more realistic PWS gradient over time. Spatial maps of Tc revealed clear visual separations of deficit irrigation treatments. We contend that Tc can be used per se as a tool to assess spatial variability of PWS at single points in time when Tc measurements are taken over a relatively short timeframe where Ta and vapour pressure deficit can be considered constant. However, dT, CWSI-I and CWSI-II are the preferred indices of PWS for temporal comparisons between different days and/or times of the day. Our results confirm the suitability and utility of ground-based vehicles for fast and on-demand assessments of spatial and temporal variability of PWS in orchards.
Using Green Atlas Cartographer to investigate orchard-specific relationships between tree geometry, fruit number, fruit clustering, fruit size and fruit colour in commercial apples and pears
Scalisi, A., McClymont, L., Peavey, M., Morton, P., Scheding, S., Underwood, J., Goodwin, I.
Acta Horticulturae, 2023
applespearsyield estimationcanopy geometryfruit clusteringfruit sizefruit colour
Show AbstractThis study investigated the adoption of a commercial, sensorised platform - namely Green Atlas Cartographer, equipped with a network of proximal sensors (including cameras and LiDAR) and machine learning algorithms - to evaluate orchard-specific relationships between estimated tree geometry, fruit number, fruit clustering, fruit size and fruit colour in commercial apple and pear orchards. The study was conducted at three commercial apple and pear sites in the Goulburn Valley (Victoria, Australia) during the 2021-2022 season. Estimations of canopy area, canopy height, canopy density and cross-sectional leaf area were generated using LiDAR technology. Fruit number, fruit clustering, fruit colour development and fruit diameter were estimated using a combination of machine vision and deep learning. The geo-referenced data points generated by Cartographer were grouped into spatial plots and statistics by plot were obtained. Correlation and principal component analyses of harvest crop parameters unveiled underlying relationships between tree geometry, productive performance and fruit quality attributes. The relationships obtained in this study can drive orchard design strategies and dictate management decisions so that trees can be standardised to consistently produce high-quality fruit over the lifespan of modern apple and pear orchards.
A Fruit Colour Development Index (CDI) to Support Harvest Time Decisions in Peach and Nectarine Orchards
Scalisi, A., O'Connell, M., Islam, M., Goodwin, I.
Horticulturae, 2022
peachesnectarinesfruit colour
Show AbstractFruit skin colour is one of the most important visual fruit quality parameters driving consumer preferences. Proximal sensors such as machine vision cameras can be used to detect skin colour in fruit visible in collected images, but their accuracy in variable orchard light conditions remains a practical challenge. This work aimed to derive a new fruit skin colour attribute—namely a Colour Development Index (CDI), ranging from 0 to 1, that intuitively increases as fruit becomes redder — to assess colour development in peach and nectarine fruit skin. CDI measurements were generated from high-resolution images collected on both east and west sides of the canopies of three peach and one nectarine cultivars using the commercial mobile platform Cartographer (Green Atlas). Fruit colour (RGB values) was extracted from the central pixels of detected fruit and converted into a CDI. The repeatability of CDI measurements under different light environments was tested by scanning orchards at different times of the day. The effects of cultivar and canopy side on CDI were also determined. CDI data was related to the index of absorbance difference (IAD) — an index of chlorophyll degradation that was correlated with ethylene emission — and its response to time from harvest was modelled. The CDI was only significantly altered when measurements were taken in the middle of the morning or in the middle of the afternoon, when the presence of the sun in the image caused significant alteration of the image brightness. The CDI was tightly related to IAD, and CDI values plateaued (0.833 ± 0.009) at IAD ≤ 1.20 (climacteric onset) in ‘Majestic Pearl’ nectarine, suggesting that CDI thresholds show potential to be used for harvest time decisions and to support logistics. In order to obtain comparable CDI datasets to study colour development or forecast harvest time, it is recommended to scan peach and nectarine orchards at night, in the early morning, solar noon, or late afternoon. This study found that the CDI can serve as a standardised and objective skin colour index for peaches and nectarines.
A Ground-based Platform for Reliable Estimates of Fruit Number, Size, and Color in Stone Fruit Orchards
Islam, M., Scalisi, A., O'Connell, M., Morton, P., Scheding, S., Underwood, J., Goodwin, I.
HortTechnology, 2022
peachesplumsnectarinesapricotsyield estimationfruit sizefruit colour
Show AbstractAutomatic in-field fruit recognition techniques can be used to estimate fruit number, fruit size, fruit skin color, and yield in fruit crops. Fruit color and size represent two of the most important fruit quality parameters in stone fruit (Prunus sp.). This study aimed to evaluate the reliability of a commercial mobile platform, sensors, and artificial intelligence software system for fast estimates of fruit number, fruit size, and fruit skin color in peach (Prunus persica), nectarine (P. persica var. nucipersica), plum (Prunus salicina), and apricot (Prunus armeniaca), and to assess their spatial and temporal variability. An initial calibration was needed to obtain estimates of absolute fruit number per tree and a forecasted yield. However, the technology can also be used to produce fast relative density maps in stone fruit orchards. Fruit number prediction accuracy was ≥90% in all the crops and training systems under study. Overall, predictions of fruit number in two-dimensional training systems were slightly more accurate. Estimates of fruit diameter (FD) and color did not need an initial calibration. The FD predictions had percent standard errors <10% and root mean square error <5 mm under different training systems, row spacing, crops, and fruit position within the canopy. Hue angle, a color attribute previously associated with fruit maturity in peach and nectarine, was the color attribute that was best predicted by the mobile platform. A new color parameter—color development index (CDI), ranging from 0 to 1—was derived from hue angle. The adoption of CDI, which represents the color progression or distance from green, improved the interpretation of color measurements by end-users as opposed to hue angle and generated more robust color estimations in fruit that turn purple when ripe, such as dark plum. Spatial maps of fruit number, FD, and CDI obtained with the mobile platform can be used to inform orchard decisions such as thinning, pruning, spraying, and harvest timing. The importance and application of crop yield and fruit quality real-time assessments and forecasts are discussed.
Reliability of a commercial platform for estimating flower cluster and fruit number, yield, tree geometry and light interception in apple trees under different rootstocks and row orientations
Scalisi, A., McClymont, L., Underwood, J., Morton, P., Scheding, S., Goodwin, I.
Computers and Electronics in Agriculture, 2021
applesblossom countsyield estimationcanopy geometrylight interception
Show AbstractModern horticulture is undergoing a rapid change with the introduction of new predictive technologies that help maximise the automation of orchard management practices. This study aimed to calibrate and validate a commercial sensorised mobile platform for the prediction of flower cluster number, fruit number and yield, tree geometry in ‘ANABP-01′ apples. In addition, this work (i) modelled the relationships between tree geometry and light interception, and (ii) determined the effects of light interception, rootstock and row orientation on flower cluster number, crop load, yield and tree geometry. Results showed that predictions were very accurate after initial calibration. Flower cluster detections had an error (RMSE) of ~5 clusters / image. Fruit number and yield predictions needed independent calibration across rootstocks but errors after validation on a separate dataset were small (RMSE = 5 fruit / tree, and RMSE = 1 kg / fruit, for fruit number and yield, respectively). Orchard errors for fruit number and yield estimations were lower than 5 %. Canopy area, canopy density and canopy cross-sectional leaf area (CSLA) were all linearly related with effective area of shade (EAS, integrated daily canopy light interception) but CSLA had the most robust and stable relationship with intercepted light. Increasing CSLA led to higher flower cluster number, fruit number and yield. Row orientations and rootstocks significantly affected productive performance, tree size and geometry and light interception. The orchard heatmaps generated after data validation proved very useful to support orchard management decisions. Overall, the predictive technology demonstrated to be a valid tool to combine accurate estimates of several important fruit crop parameters (i.e. flower cluster number, fruit number, yield, tree size and geometry, and light interception) in a single platform.
Industry Articles and Tech Reports
Green Atlas Cartographer for Precision Crop Load Monitoring
Bhalekar, D., Mungia de la Cruz, J., Sallato, B., Khot, L.
Washington State University, 2026
applesblossom countsyield estimationfruit size
Show AbstractOver the past two seasons (2024 and 2025), several commercial ground- and aerial-vision systems have been validated at WSU Smart Apple Orchard Testbeds in Mattawa and Zillah, WA. Among these, Green Atlas Cartographer, in collaboration with Innov8.Ag Inc. was evaluated for precision crop-load monitoring. This article describes the technology and summarizes the validation results by the WSU team.
Managing apple yield and quality variability
Peavey, M., Scalisi, A.
Australian Fruit Grower, 2024
applesyield estimationblossom countsfruit colour
Show AbstractHigh levels of variability in marketable yield in an orchard block reduces profitability. However, these losses can be regained through precise and well- timed management practices that target crop load, fruit size and colour. As part of the PIPS 4 Profit Optimising apple production systems (AP22004) project, Agriculture Victoria researchers are exploring the benefits of spatial (zoning) management to reduce crop variability. In addition to testing agronomical and technological applications, the economic impact of adapting to these more focused management practices will be assessed by considering the cost of using relevant technologies and adjustments to labour hours, yield and packout. Orchard block zoning is rapidly performed using mobile sensing technology, such as the Green Atlas Cartographer (Figure 1), that was tested and validated in the PIPS3 Advancing sustainable and technology driven apple orchards (AP19003) project. These sensing platforms can collect data on orchard flower density, crop load, fruit size and colour, and create colour-coded maps to display the differences within a block. Subdividing a block into management zones allows us to better target and apply appropriate management techniques.
Road to Robustness: Digital measurements of tree growth for precision orchard and fruit robustness management
McCauley, D., Asad Ullah, M., Stefanelli, D.
Talking Avocados, 2024
avocadoscanopy geometry
Show AbstractA goal of orchard management is producing consistent good quality saleable fruit that satisfies consumers and assures return buy. One way this could be achieved is by addressing fruit robustness. Fruit robustness is a term used to describe fruit with qualities that allow them to withstand postharvest rigours including handling, storage, time, and temperature fluctuations in the supply chain, especially those aimed for export markets. Less robust fruit are more prone to rots and disorders and can turn away consumers from repeat purchases of avocados. Fruit robustness is the topic of the national Hort Innovation funded project “AV21005- Growing Robust Avocados” researching what drives fruit robustness and how to achieve it consistently. We used the Green Atlas Cartographer platform to regularly perform early season measurements of tree growth as a proxy of fruit robustness. The Cartographer was effective at identifying growth trends across different sites and was able to identify possible management zones for agronomic interventions as well.
Technology driven apple orchards
Goodwin, I., Scalisi, A., Plozza, T., Reddy, P., Peavey, M.
Australian Fruit Grower, 2023
applesyield estimationfruit colour
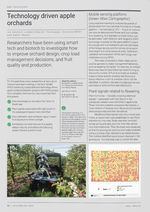
Show AbstractUsing machine learning to analyse thousands of photos taken from two cameras mounted on a mobile platform – for example an ATV – fruit in an orchard can now be detected and flower and fruit number, fruit clustering, fruit diameter and peel colour can be estimated. Light detection and ranging (LiDAR) technology mounted on the same platform scans the canopy and is processed to provide estimates of the foliage density and the canopy dimensions (tree height and cross-sectional area). Calibration, validation and evaluation of this technology was undertaken during PIPS3. The maps produced by Green Atlas can be used by growers to make management decisions, such as targeting ‘hot spots’. For example, an orchard block may need to have follow-up hand thinning to reduce the number of fruit or to break up clusters. Areas to focus autumn pruning, leaf blowing or laying reflective mulch to increase colour can be identified. In addition, the data provides pre-harvest estimates of yield and fruit size distribution.
Smarter pear orchards
Goodwin, I., McClymont, L., Scalisi, A.
Australian Fruit Grower, 2023
pearsyield estimationfruit colourblush estimation
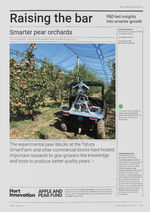
Show AbstractPear fruit size, fruit blush coverage and tree size (for example, canopy height and density, pruning mass) within an orchard block can now be measured with accuracy and precision. The technology processes optical images and light detection and ranging (LiDAR) data collected from cameras and a scanner mounted on a mobile platform, such as an ATV, that drives up and down orchard rows. Machine learning is used to detect fruit on the images and extract data on fruit diameter and fruit colour. As such, fruit can also be counted; however, some fruit will be obscured by foliage, so the fruit number per tree will not be as accurate as estimates of fruit size and colour. More accurate estimates of fruit number can be made by undertaking a block-specific calibration, although the raw data is sufficient to observe the relative variation across an orchard block. Similarly, flower clusters can be detected and counted, but calibration is required for the prediction of absolute numbers.
Integrating soil and vision technologies for improving apple production
Finger, N.
Apples and Pears Australia Limited, 2023
applesyield estimationfruit sizefruit coloursoil chemistry
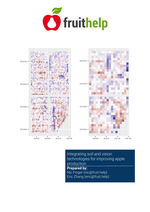
Show AbstractThe Green Atlas Cartographer, a ground-based scanning system that uses LiDAR and camera technologies, was used to measure tree and fruit characteristics, namely; fruit number, size, colour and degree of clustering (how close fruit are together) and tree size (height, canopy area, leaf area, canopy density). Soil was sampled on a 50 m grid basis throughout the orchard within a single homogenous planting (commonly referred to as a block within the industry). These samples were analysed using the service provider, Gridfarm™ to produce grid-based data across the sampled blocks demonstrating the variability in individual soil nutrients and ratios. These two datasets (Green Atlas and Gridfarm) were layered in GIS software to allow for correlation analysis which highlighted the effects of underlying soil nutrient variability on both fruit and tree characteristics. This information will help to develop the business case for growers investing in variable-rate fertiliser application within orchard environments by identifying the extent of variability and likely costs involved to implement. In addition to correlation with soil, the data collected also helps growers improve the accuracy of crop estimates and prediction of packhouse outcomes ahead of time. Prior to harvest time (March) fruit size and colour were assessed again to confirm that data outputs are consistent downstream of the field scans.
Orchard estimates of blush coverage in pears
Goodwin, I., McClymont, L., Scalisi, A.
Australian Fruit Grower, 2022
pearsfruit colourblush estimation
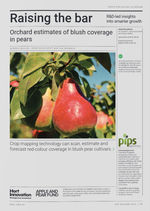
Show AbstractBlush pear cultivars have been the focus of several international breeding programs because of export demand for high-quality red-colour peel coverage. It is one of the most important fruit quality features of red-coloured pears – the attractive appearance being associated with health benefits by overseas consumers. As a component of the PIPS3 Program’s Developing smarter and sustainable pear orchards to maximise fruit quality, yield and labour efficiency (AP19005) project, Agriculture Victoria has been working closely with Australian agtech company Green Atlas to estimate crop parameters such as fruit number, fruit size and fruit skin colour by scanning orchards with the commercially available mobile platform Cartographer. Recent research has demonstrated the ability to use the Green Atlas technology to accurately measure colour development in peach and nectarine orchards with a colour development index (CDI) ranging from 0 (green) to 1 (red). The accuracy of CDI maps to describe and track redness development was further validated with apple cultivar ‘Ruby Matilda’.
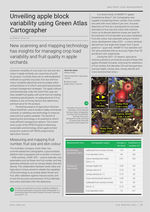
Unveiling apple block variability using Green Atlas Cartographer
Scalisi, A.
Australian Fruit Grower, 2022
applesyield estimationfruit sizefruit colourcanopy geometry
Show AbstractExcessive variability of crop load, fruit size and skin colour in apple orchards can cause loss of profit for growers. Currently there are no well-established methods to quantify crop load, fruit size and fruit colour variability objectively and accurately within orchard blocks or to inform and automate precision orchard management strategies. The apple cultivars sold domestically under the name Pink Lady can have variable fruit quality, with some fruit not meeting marketing specifications. An adequate level of fruit redness is one of the key factors that determines premium price for the produce. Pioneering research at Agriculture Victoria’s Tatura SmartFarm, and in Goulburn Valley commercial orchards, is validating new technology to measure yield and fruit quality variability. The benefit of exploring this technology is its potential to inform more efficient management options. The current work is part of the PIPS3 Program’s Advancing sustainable and technology driven apple orchard production systems (AP19003) project led by Agriculture Victoria.
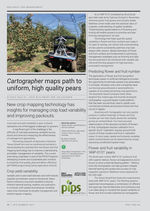
Cartographer maps path to uniform, high quality pears
Scalisi, A., McClymont, L., Goodwin, I.
Australian Fruit Grower, 2021
pearsyield estimationblossom counts
Show AbstractCrop load and yield variability in pear orchards represents one of the biggest challenges for growers. A significant part of the challenge is the difficulty of manually assessing variability across blocks and time and measuring the effectiveness of management approaches. Pioneering research at Agriculture Victoria’s Tatura SmartFarm and on commercial orchards is demonstrating the potential that new flower and fruit mapping technology has to improve understanding and better management of variability. The current work being undertaken is part of the PIPS3 Program’s Developing smarter and sustainable pear orchards to maximise fruit quality, yield and labour efficiency (AP19005) project being led by Agriculture Victoria.
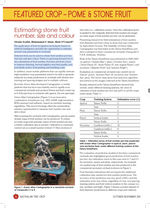
Estimating stone fruit number, size and colour in stonefruit
Scalisi, A., Islam, M., O'Connell, M.
Australian Tree Crop, 2021
apricotspeachesplumsnectarinesyield estimationfruit sizefruit colour
Show AbstractThe application of fruit recognition techniques based on artificial intelligence provides the opportunity to estimate several crop parameters in orchards. Detected fruit can be used to obtain fruit number per tree, fruit size and skin colour. There is a growing demand for in situ estimations of fruit number, fruit size and fruit colour to improve thinning, harvest logistics and fruit quality, and potentially reduce fruit grading and handling costs.
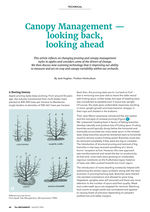
Canopy Management – looking back, looking ahead
Hughes, J.
Fruition Horticulture, 2020
applescanopy geometry
Show AbstractThis article reflects on changing pruning and canopy management styles in apples and considers some of the drivers of change. We then discuss new scanning technology that is improving our ability to measure and act on crop and canopy variability within our orchards.
Videos
Sensing technologies to improve predictions and management of crop load – a PIPS3 update
Scalisi, A.
YouTube, 2023
applesyield estimationpruning weight
Show AbstractDr Alessio Scalisi, Senior Technology Officer with Agriculture Victoria, gives an update on the PIPS3 AP19003 Advancing sustainable and technology driven apple orchard production systems project at the Tatura SmartFarm. Hear how the Green Atlas Cartographer™ was used over winter in the Sundial Orchard to predict pruning weight. The research team is also developing a new bud counting feature for Cartographer, which will help growers with crop load management.