Weed Management
At a Glance
| Challenge | Finding weeds in or near an orchard canopy can be like finding a needle in a haystack, particularly when the weeds are partially obscured by surrounding foliage. |
|---|---|
| Solution | Green Atlas Cartographer is able to precisely map visible weed outbreaks using its high resolution cameras and powerful onboard lighting system. Even parasitic plants that occupy space inside the productive tree canopy are able to be distinguished and mapped. |
| Result | A rapid, objective assessment of the weed pressure within the orchard and geolocated maps to prioritise the allocation of crews to the highest pressure locations, maximising available resource utilisation for remediation. |
The Needle in a Haystack Canopy Search
Scouting for weed outbreaks is costly, time-consuming work.
Traditional Integrated Pest Management (IPM) relies on manual scouting; scouts walking a fraction of the orchard rows, checking sticky traps, and looking for visual symptoms. This method has severe limitations:
- Concealed Pressures: Weeds on the orchard floor or suckers low to the ground are often hidden by low-hanging crop foliage, irrigation lines, inter-row cover crops or shadowing.
- Canopy Intruders: Parasitic plants anchor themselves directly inside the productive tree canopy. Because they match the general green hue of the orchard, they blend in extremely well, making them extremely challenging to spot from a tractor cabin or during a quick ground walk.
- Cost of Missed Detection: If rootstock suckers or parasitic weeds are missed, they divert vital energy away from fruit or nut production. Over time, they can weaken the host tree, impede harvesting, and harbor pests.
Objective Automated Visual Inspection
Replace manual scouting with rapid, objective measurements of every row.
Green Atlas Cartographer strips away the visual camouflage of unwanted vegetation, using high-speed machine vision to audit the entire orchard environment.
- Shadow-Free Optical Profiling: The system’s high-intensity strobe lighting eliminates natural shadows and overpowers ambient light. This allows the high-resolution cameras to capture crisp, uniform imagery from the orchard floor right up through the internal scaffolding of the canopy.
- Advanced Botanical Discrimination: The image processing algorithms are trained to identify specific morphological leaf shapes and leaf/shoot structure that differ from the commercial crop.
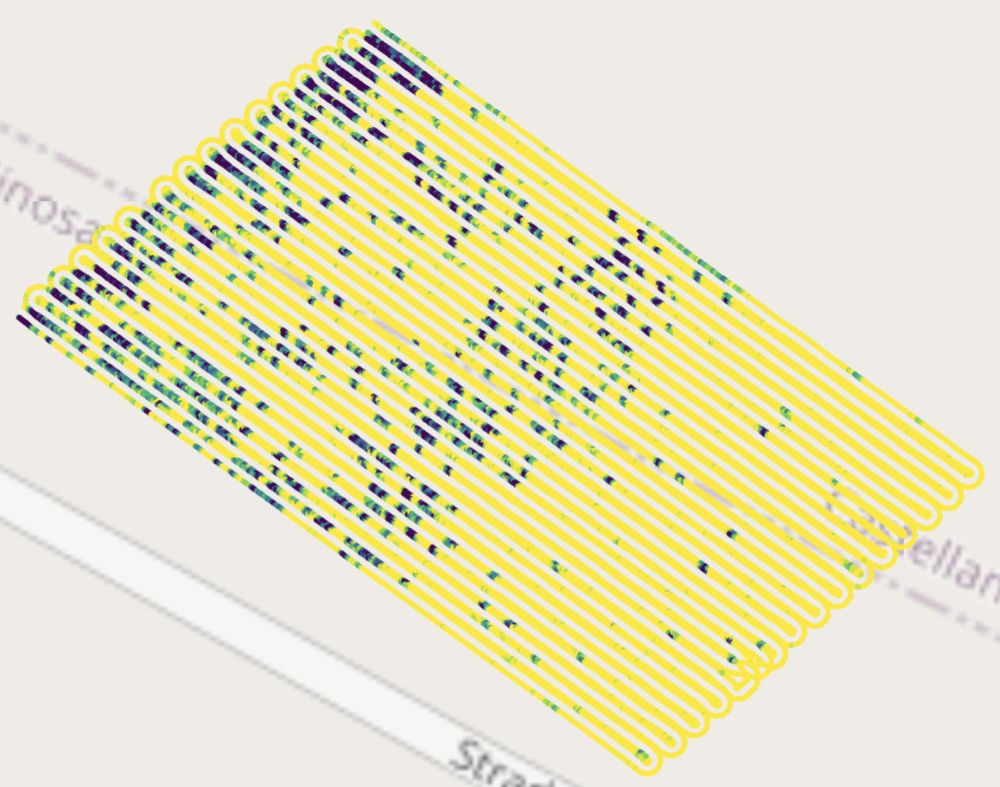
- Geolocated Encroachment Mapping: Every detected weed is flagged with precise GPS coordinates. This data is translated into a Weed Pressure Map, giving management a complete spatial view of where weeds and suckers are establishing themselves.
Targeted Eradication and Reduced Resource Utilisation
Objectively map and mitigate weed pressures
By transforming weed scouting into a rapid, automated scan, growers can transition from reactive orchard scouting to precise, localised remediation:
- Surgical Crew Deployment: Instead of paying crews to investigate every single hectare looking for hidden growth, managers use geolocated maps to guide teams directly to high weed pressure zones. Labor is spent entirely on eradication rather than searching.
- Precision Chemical & Mechanical Control: Pressure maps can be used to drive variable-rate herbicide sprayers or mechanical weeding implements. Equipment can automatically spot-spray or activate tools only where outbreaks are verified, reducing chemical usage and protecting soil health.
- Preserving Tree Vigor: By catching weeds such as rootstock suckers and canopy parasites early, they can be removed before they permanently sap the host tree's nutrients, ensuring maximum energy is directed into profitable crop yield.
Examples of Weed Mapping in Action
The value of weed pressure mapping
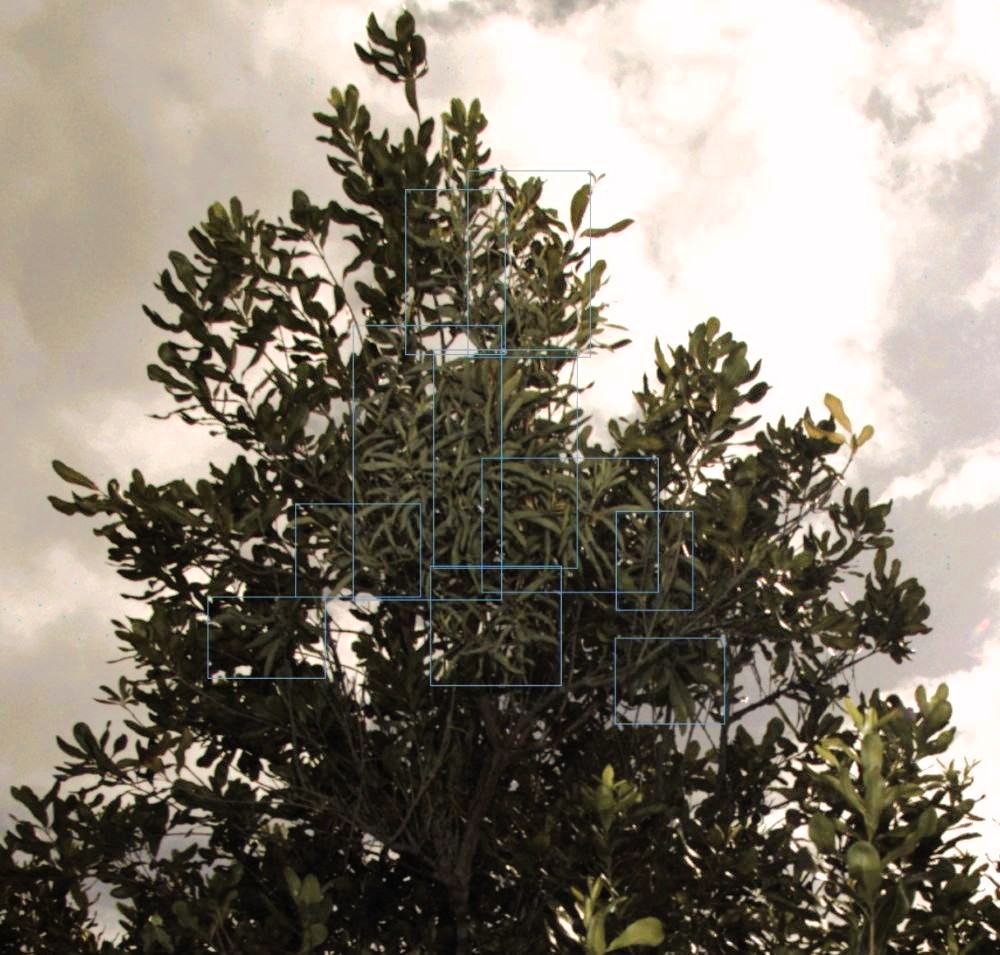
Mistletoe Mapping within Macadamia Nut Canopies
Problem: Mistletoe is a parasitic plant that mimics the canopy of the host tree, stealing water and nutrients from the macadamia branches.
Action: Cartographer scans the orchard rows, using its high-resolution cameras and onboard lighting to peer into the macadamia canopy. Image processing algorithms look for the telltale structural and leaf variations that differentiate mistletoe from macadamia foliage.
Value: Manually scouting for mistletoe across a large plantation is often cost-prohibitive. Cartographer provides a ‘strike list’ map of infected trees, allowing specialised pruning crews to move efficiently through the orchard, cutting out the parasite before it can cause more harm to the host macadamia tree.
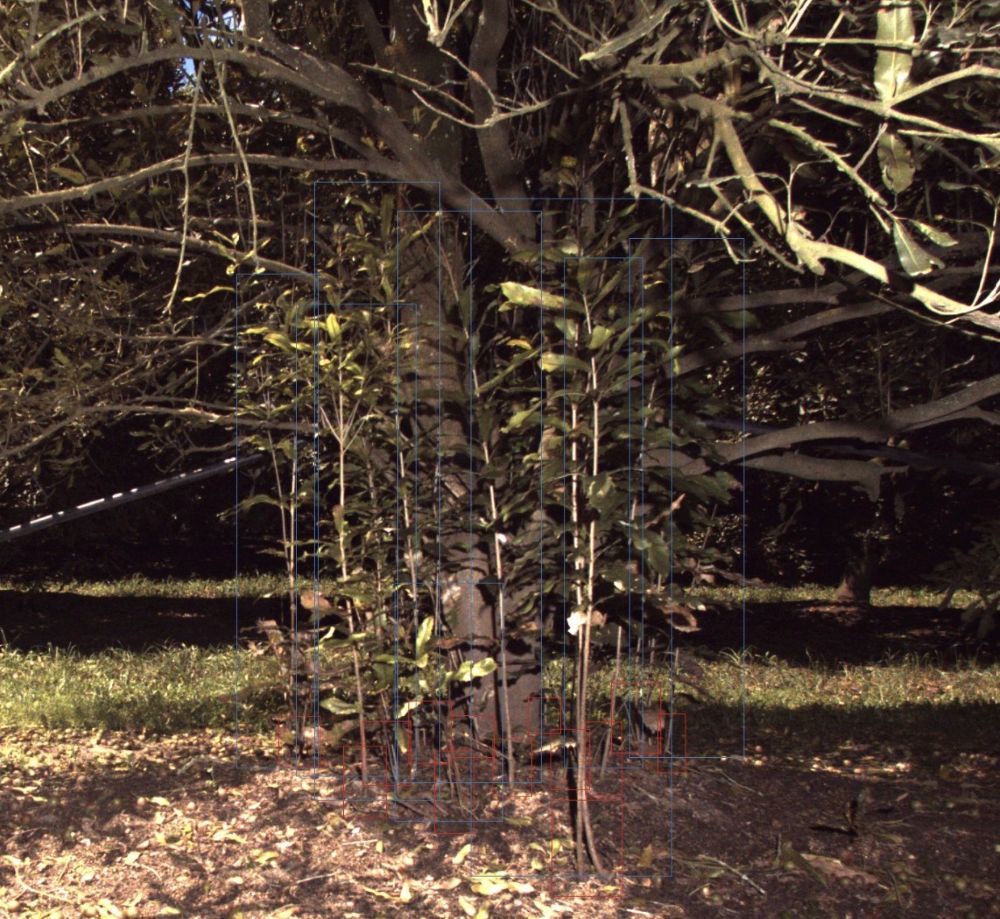
Rootstock Sucker Mapping
Problem: Suckers are vigorous vegetative shoots sent out by the tree's rootstock near the base of the trunk and are considered weeds in most commercial crops. They drain the tree's energy, can interfere with harvest machinery and potentially crowd-out the commercial tree above.
Action: Cartographer scans the lower tree zone, detecting and counting suckers emerging from the trunk or base, even when partially obscured by low-hanging low-tier branches or tall grass.
Value: The resulting map directs chemical or manual de-suckering crews only to the trees that require treatment. This eliminates the need for conservative blanket chemical applications down every single row, saving money and reducing chemical drift risks. Manual de-suckering crews don’t spend time searching, only performing productive tasks.
Get Started
Map and eradicate weed pressures.
Find your nearest Green Atlas service provider to discuss how to implement weed pressure mapping in your orchard.