Pests and Diseases
At a Glance
| Challenge | Objective measurement of disease outbreaks or pest pressures within orchards is time consuming and expensive using conventional manual assessment methods. It’s not uncommon to miss localised outbreaks completely, putting a significant percentage of the orchard or annual crop at risk. |
|---|---|
| Solution | Green Atlas Cartographer is able to precisely map visible pest and disease outbreaks using its high resolution cameras and powerful onboard lighting system. |
| Result | A rapid, objective assessment of the pest or disease pressure within the orchard and geolocated maps to prioritise the allocation of crews to the highest pressure/risk locations, maximising resource utilisation and minimising risk. |
The Invisibility of Early Infestations
Scouting for outbreaks is costly, time-consuming work.
Traditional Integrated Pest Management (IPM) relies on manual scouting; scouts walking a fraction of the orchard rows, checking sticky traps, and looking for visual symptoms. This method has severe limitations:
- The Needle in a Haystack Problem: Because scouts can only physically inspect a tiny percentage of the trees or vines, localised hotspots (the initial source of an outbreak or pest harbor) are frequently missed entirely.
- Subjective Severity Ratings: Human scouts often grade pest pressure or leaf damage subjectively (e.g., ‘mild’ vs. ‘severe’), making it difficult for management to track the exact rate of spread or compare different blocks objectively.
- Reactive Over-Spraying: When an outbreak is finally detected via traditional scouting, it is not unusual to be conservative with spraying to minimise pest or disease risk, potentially wasting money on expensive pesticides and altering beneficial insect populations in adjacent, but clean areas of the orchard.
High-Resolution Visual Pest and Disease Mapping
Replace manual sampling with objective measurements of every row.
Green Atlas Cartographer acts as an automated, high-speed bio-surveillance tool, using its advanced imaging payload to detect visual anomalies across every single row and tree.
- Standardised Imaging: The system utilises high-resolution cameras paired with high-intensity strobe lighting to capture crystal-clear images of the canopy from top to bottom at high speed. The controlled illumination provides visual consistency, making the symptoms of pest pressures or disease outbreaks able to be more reliably and objectively identified compared to solutions without controlled lighting.
- Automated Symptom Recognition: The onboard machine-vision system is trained to identify specific, visually apparent signatures of pest and disease pressure. This includes symptoms like leaf reddening/yellowing, leaf curling, mummified fruit/nuts etc.
- Geo-Referenced Pressure Maps: Every detected symptom is logged with precise GPS coordinates. The system processes these individual data points into an orchard-scale ‘Pest and Disease Pressure Map’, changing the solution from sporadic field notes into a comprehensive spatial epidemiological overview.
Surgical Intervention and Risk Mitigation
Objectively map and mitigate pest and disease pressures
By shifting from random sampling to a full-orchard scan, growers can catch outbreaks early and deploy their crop sanitation and protection resources with surgical precision:
- Rapid Response Maps: Growers are likely to see significant reductions in total fertiliser volume by simply not applying product to gaps, dead trees, or zones that have already reached their growth ceiling.
- Targeted Spot Spraying and Labor: Minimizing over-application directly reduces the risk of chemical leaching and run-off, helping orchards meet increasingly strict environmental regulations and sustainability certifications.
- Maximizing Resource Utilisation: By providing extra nutrients to struggling zones and tempering the inputs in over-vigorous zones, the block moves toward a more homogenous state.
Examples of Pest and Disease Mapping in Action
The value of pest and disease pressure mapping
Mummy Nut Mapping in Almond Orchards
Problem: Unharvested almonds left on the tree over winter, known as ‘mummy nuts’, serve as the primary overwintering habitat and food source for the devastating Navel Orangeworm (NOW), Carpophilus Beetle and Carob Moth (and other) pests. These pests can devastate the following seasons’ crop.
Action: Cartographer scans the dormant orchard post-harvest, using its cameras and AI to map the density of mummy nuts remaining on every single tree.
Value: Instead of manually counting nuts on a tiny sample of trees to guess the pest risk, managers receive a geolocated map showing exactly which zones harbor the highest mummy nut numbers. This acts as a direct proxy for future pest pressure and allows winter sanitation crews (mechanical shaking or hand-poleing) to target the highest-risk trees, maximizing labor efficiency and drastically reducing pest populations before spring flowering. Consequently the risk of significant crop losses of up to 30% are reduced.
Grape Leafroll Virus Mapping
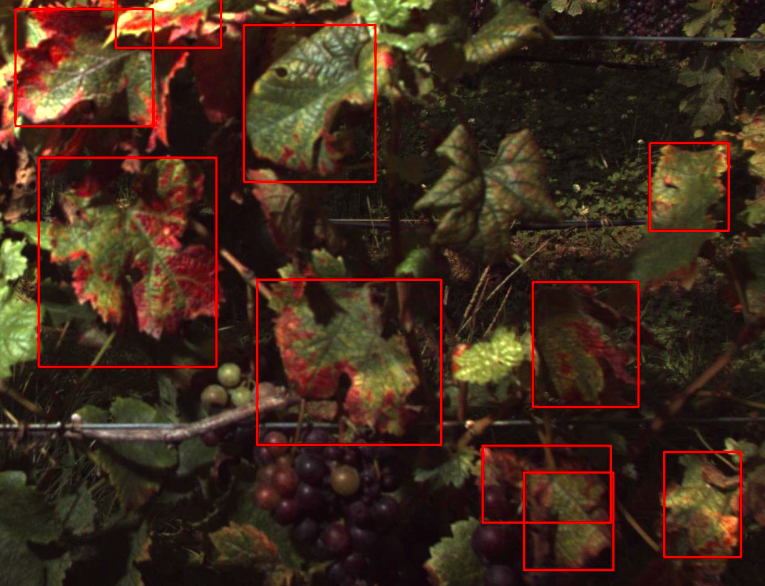
Problem: Grapevine leafroll disease impacts fruit quality, vine vigor, and overall vineyard longevity, showing distinct visual symptoms on the leaves through the growing season.
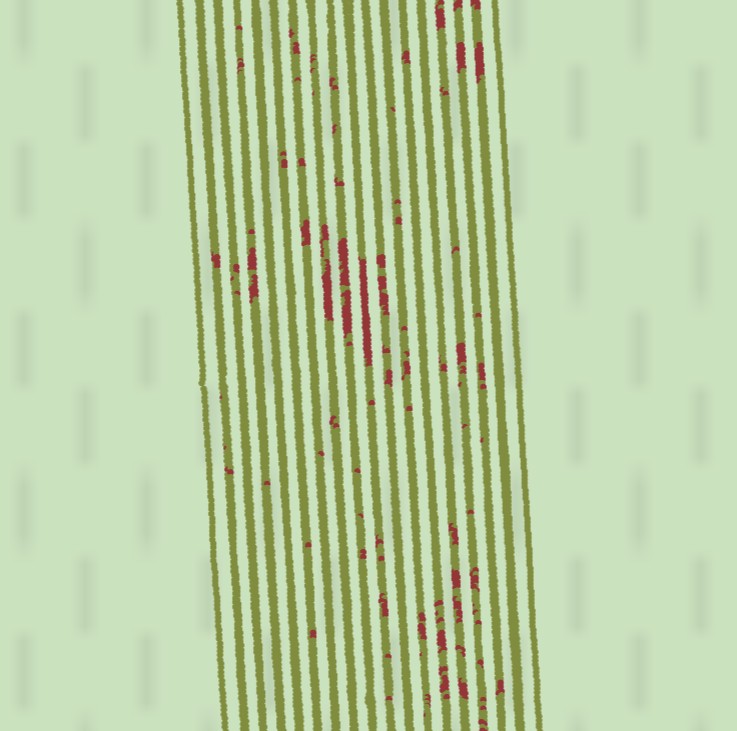
Action: Cartographer drives down the vineyard rows during the growing season (excellent results have been obtained from early through to late season scans). The image processing algorithms analyse the leaves, searching for the telltale signs of the virus, such as dark red leaf discoloration on a portion of the leaf area.
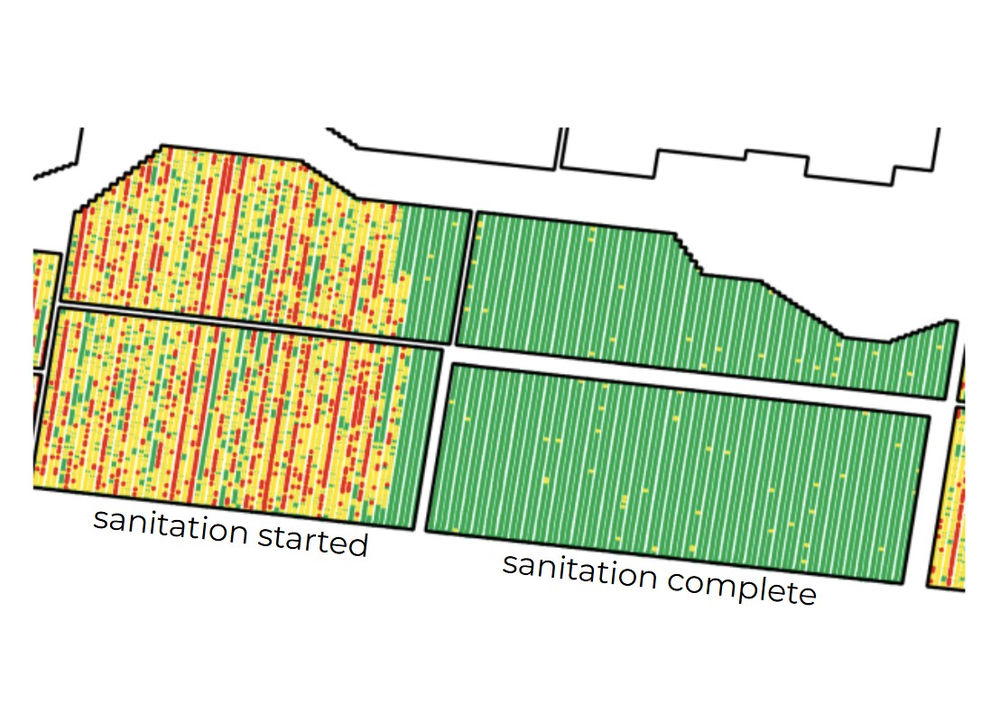
Value: Rogueing (removing infected vines) is the primary way to stop the virus from spreading. Cartographer generates a digital ‘strike list’ map of the vineyard. Rogueing crews can go straight to the infected vines using the maps, avoiding the massive expense of manual vineyard walking and ensuring that early-stage infections are caught before the disease vector spreads it to neighboring healthy vines.
Get Started
Map and ameliorate pest and disease pressures.
Find your nearest Green Atlas service provider to discuss how to implement pest and disease pressure mapping in your orchard.