Missing Trees
At a Glance
| Challenge | Obtaining an accurate estimate of the number of missing, sick and/or replanted trees within an orchard is time consuming and expensive using conventional manual assessment methods. |
|---|---|
| Solution | Green Atlas Cartographer’s direct LiDAR based geometric canopy measurement provides an objective measure of canopy structure, showing areas where canopy should be, but isn’t. |
| Result | A rapid, objective assessment of the number of missing trees within an orchard, the precise location of the missing, sick or replanted trees, and geolocated maps to guide crews to the correct locations. |
| Applicable Crops | All crops and stages. |
The Cost of Ghost Trees
Blanket applications can target empty space.
Keeping an accurate inventory of productive vs. non-productive trees across thousands of hectares is an operational bottleneck:
- Invisible Drain: Sick, missing, or newly replanted trees are often skipped during harvest, yet they still receive a standard 'blanket' application of water, fertiliser, and chemicals. Growers end up spending money on non-productive ground.
- Manual Audit Bottleneck: Counting missing trees manually requires workers to walk every single row. It is tedious, expensive, and highly prone to counting errors. Consequently, audits are rarely done, and replant orders are based on rough estimates.
- Delayed Intervention: Sick trees or gaps are often only noticed during pruning or harvest. By then, a disease may have spread, or a full planting season has been lost, delaying the block's return to peak yield capacity.
LiDAR-Based Canopy Deficit Detection
Detect what isn't there.
Green Atlas Cartographer uses its integrated LiDAR to run a continuous, high-speed structural audit, mapping what is there against what should be there.
- Geometric Void Mapping: As the Cartographer drives down a row, the LiDAR measures the expected continuity of the tree or vine row. When it hits a gap where a tree or vine canopy should be, it logs the exact GPS coordinates of the void.
- Vigor-Based Health Categorization: By analysing the volume and density of individual canopies, the system can categorise trees into three distinct structural profiles:
- Missing: Complete structural void.
- Sick/Stunted: A tree is present, but its canopy volume or leaf density is significantly below the block average (potential disease or irrigation failure).
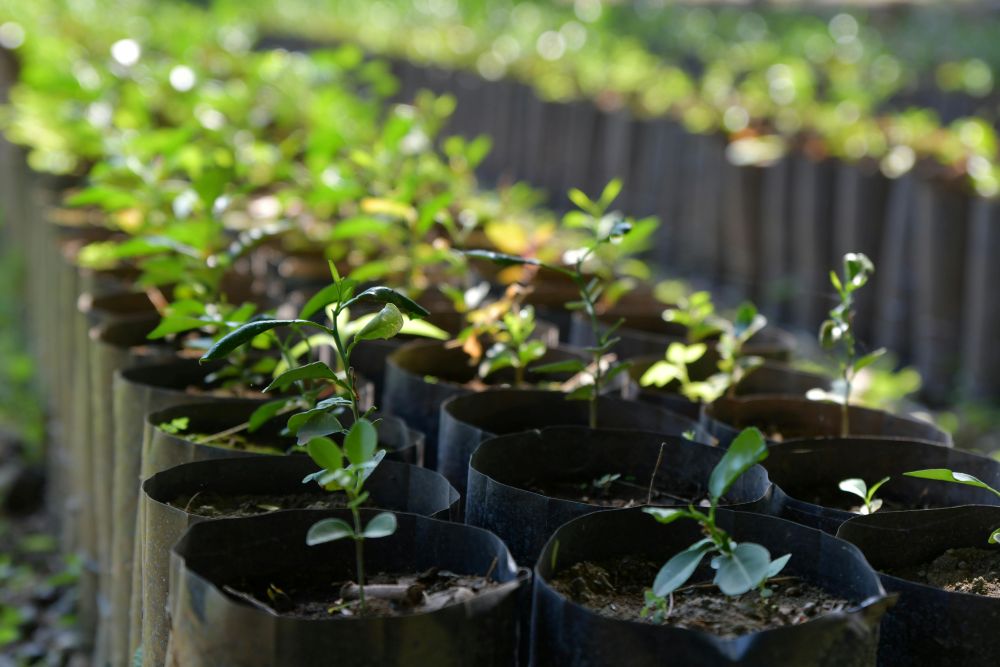
- Replant: A young tree with a small canopy profile occupying a space previously logged as missing.
- Digital Inventory Generation: The system aggregates this data into a precise, geolocated asset register, giving management an exact count of productive vs. non-productive units.
Precision Auditing and Targeted Remediation
Know where to plant.
By transforming the physical layout of the orchard into a digital asset map, growers streamline their orchard maintenance workflows:
- Pinpoint Replant Planning: Instead of guessing how many trees to order for the next planting window, managers have a shopping list per block (e.g., "Block 4 needs 142 trees"). This minimises the costs of over-ordering or the delays of under-ordering.
- Guided Ground Crews: The system outputs geolocated Task Maps that can be loaded onto mobile phones or tractor GPS units. Ground crews can drive or walk directly to the sick or missing trees without wasting time searching rows, increasing labor efficiency.
- Early Disease Detection: Spotting pockets of low-vigor trees early allows agronomists to investigate localised issues, such as poor soil quality, blocked irrigation emitters, or root rot outbreak, before the damage is able to spread.
Examples of Tree Census Mapping in Action
How tree census data enhances orchard efficiency and profitability.
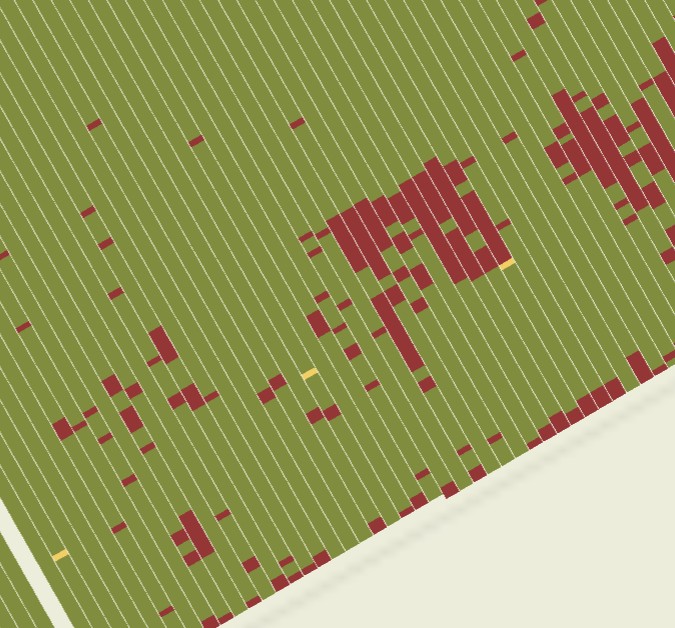
Replant List Report
The system cross-references the LiDAR scan with the orchard's expected planting density, generating a report or spreadsheet detailing the proportion and location of missing/stunted/replanted trees, as a map, or tallied per block and per row. Clear and precise visualisation and quantification helps to plan targeted remediation activities and streamline logistics. It also allows replanting stocks to be placed in the headland at the correct row, ahead of the arrival of the replanting crew, minimising rehandling and the time cost of moving plants from row to row.
Sick Tree Visualisation (Hotspot Detection)
Map zones where multiple consecutive trees are flagged as 'low-density/sick'. This often reveals systemic orchard issues, such as a ruptured sub-surface irrigation pipe or a specific soil zone that requires drainage or other remediation. Issues can be efficiently rectified, improving the overall health and productivity of the orchard.
Capital Valuation and Insurance Audits
Cartographer can provide a report or spreadsheet showing the relative proportion of productive trees in an orchard to banks, investors, or crop insurance companies. This provides an objective estimate of the true asset value of the orchard based on whole-of-orchard tree vigor (and/or crop load) data, securing better financing or more accurate insurance underwriting.
Get Started
Document the number of missing or stunted trees.
Find your nearest Green Atlas service provider to discuss how Cartographer missing tree estimates can improve your orchard's bottom line.