Crop Loss
At a Glance
| Challenge | After a hail storm or other external catastrophic event, crop loss assessment in tree crops is typically reliant on manual assessment of a small portion of the damaged crop, leading to disputes between growers and their insurers. |
|---|---|
| Solution | Green Atlas Cartographer enables rapid, repeatable and objective measurements of crop defects across entire affected areas, together with an assessment of severity. |
| Result | Quantified maps of the level of damage in all affected areas and reports detailing the likely percentage loss across affected blocks. Disputes resolved through objective and independent data collection. |
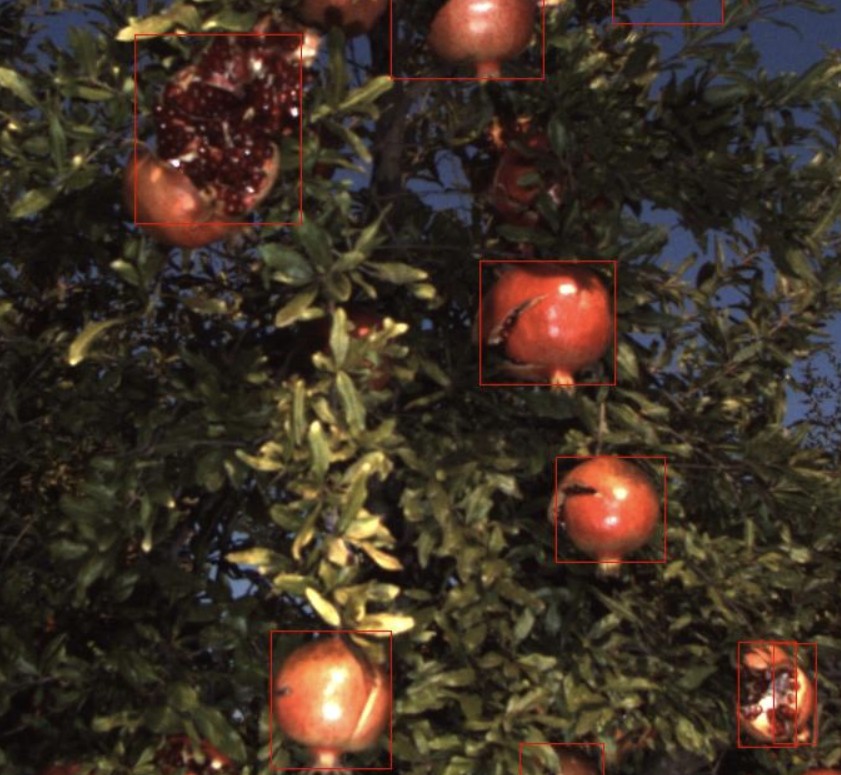
| Applicable Crops | Apple hail damage. Pomegranate splitting. Other crops and damage types on demand. |
The Conflict of Subjective Sampling
Manual assessment is subject to contentious interpretation.
After a hail storm, or other catastrophic external event, determining the percent crop-loss is traditionally a slow and contentious process:
- The Sampling Gap: Loss adjusters typically inspect only a few trees or bins. In a large orchard, damage is rarely uniform; hail may hit one corner of a block with devastating force while leaving the other side untouched.
- The Dispute Cycle: Growers may feel the damage is undervalued, while insurers may feel the samples are biased toward the worst areas. This lack of objective data leads to prolonged legal or financial disputes.
- Hidden Damage: Manual inspections can easily miss damage in hard to get to areas of canopy, leading to an underestimation of total loss that only becomes apparent at the packing shed, potentially long after an insurance claim has been settled.
Digital Forensic Mapping
Objective total block assessment.
Green Atlas Cartographer provides a digital audit of the damage, replacing small-scale samples with a total block assessment.
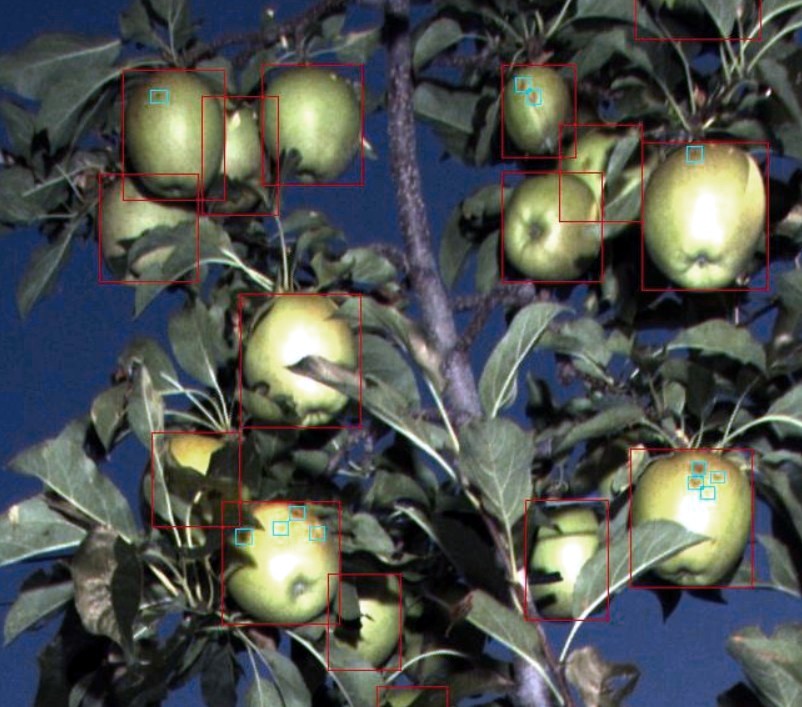
- High-Resolution Defect Detection: Using image processing algorithms trained to recognize specific trauma, the system identifies defects such as bruising, skin splitting, limb rub, and external browning caused by hail or other extreme weather.
- Severity Grading: The system is able to go beyond binary ‘damaged/not damaged’ logic. It assesses the severity per fruit (e.g., number of hail strikes per apple), allowing for a precise calculation of how much fruit has dropped from Premium to Juice grade or even Total Loss.
Objective Resolution and Recovery Planning
Independent, objective, dispute resolution.
By turning physical damage into a quantified and verifiable heatmap, the Cartographer acts as an independent source of truth for all parties involved:
- Elimination of Disputes: Reports provide a granular, tree-by-tree breakdown of damage. With objective data and photographic evidence from across the entire block, insurers and growers can reach a fair settlement quickly.
- Informed Decisions to Keep or Drop: If the data shows significant loss in a specific zone, the grower can decide to stop investing in that block or zone for the season (saving on inputs, sprays and labour). Conversely, if the damage is minimal, they can proceed with confidence.
- Salvage Logistics: Detailed maps allow managers to identify zones with salvageable fruit, enabling them to harvest and process that fruit separately to prevent good fruit from being downgraded by damaged fruit in the bin.
- Audit Trail: This data serves as a permanent record of the event, which can be used to explain yield dips or tree health issues in subsequent years.
Example: Hail Damage Severity Mapping
Total orchard defect assessment.
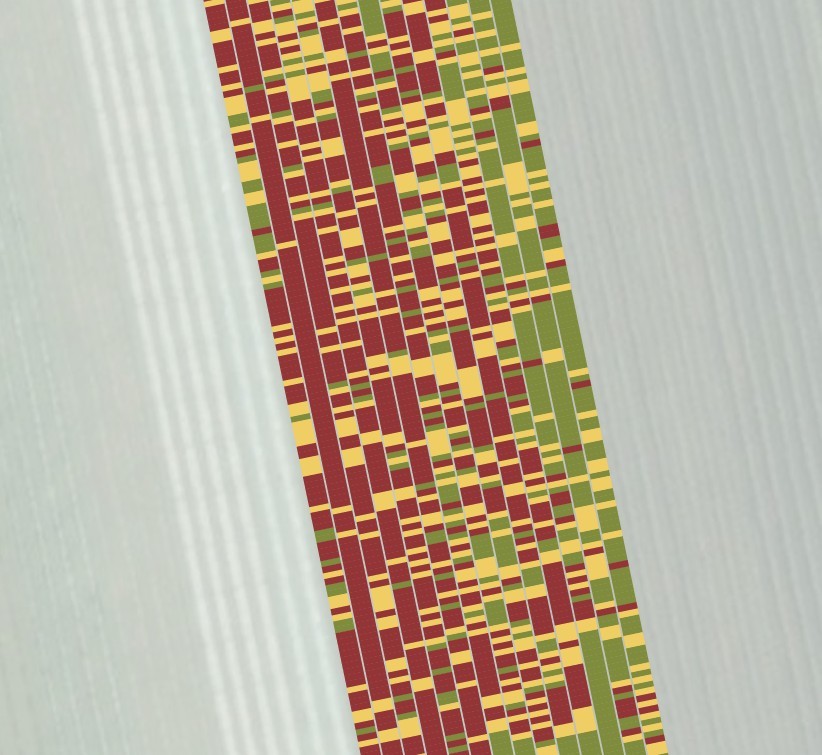
The Map: A traffic-light coded "Heatmap of Defects" where colors represent the intensity of hail strikes.
| Red — High Damage | >3 strikes per fruit; likely 100% loss. |
|---|---|
| Orange — Moderate Damage | 1-3 strikes per fruit; potential for low-grade processing. |
| Green — Low Damage/No Damage | 0-1 strikes per fruit; Minimal impact; maintain standard premium management. |
The Report: A PDF summary detailing: "Block A: 42% of fruit impacted; average of 1.8 defects per fruit”
Get Started
Get your crop loss assessed rapidly and objectively.
Find your nearest Green Atlas service provider to discuss how crop loss assessment can streamline your operations.