Trials
At a Glance
| Challenge | Conventional trial work suffers from high labour costs, small sample sizes and subjective assessments. |
|---|---|
| Solution | Green Atlas Cartographer enables objective and repeatable assessments to be cost-efficiently conducted at scale. |
| Result | A paradigm shift in understanding cause and effect through the fast and accurate measurement of multi-layered objective data of holistic plant responses at plot, block, or farm scale. |
| Applicable Crops | All crops and stages. |
The Data Bottleneck in Field Trials
Manual sampling is costly and often subjective.
In orchard trials (testing new fertilisers, pesticides, or pruning techniques etc.), the quality of the conclusions are only as good as the data collected. Research teams often face significant hurdles in gathering accurate data at sufficiently large scales:
- Scale vs. Accuracy Trade-off: To get high-accuracy data, researchers often have to limit the trial to a very small number of trees. Scaling that trial to a commercial block usually results in a loss of data resolution or accuracy.
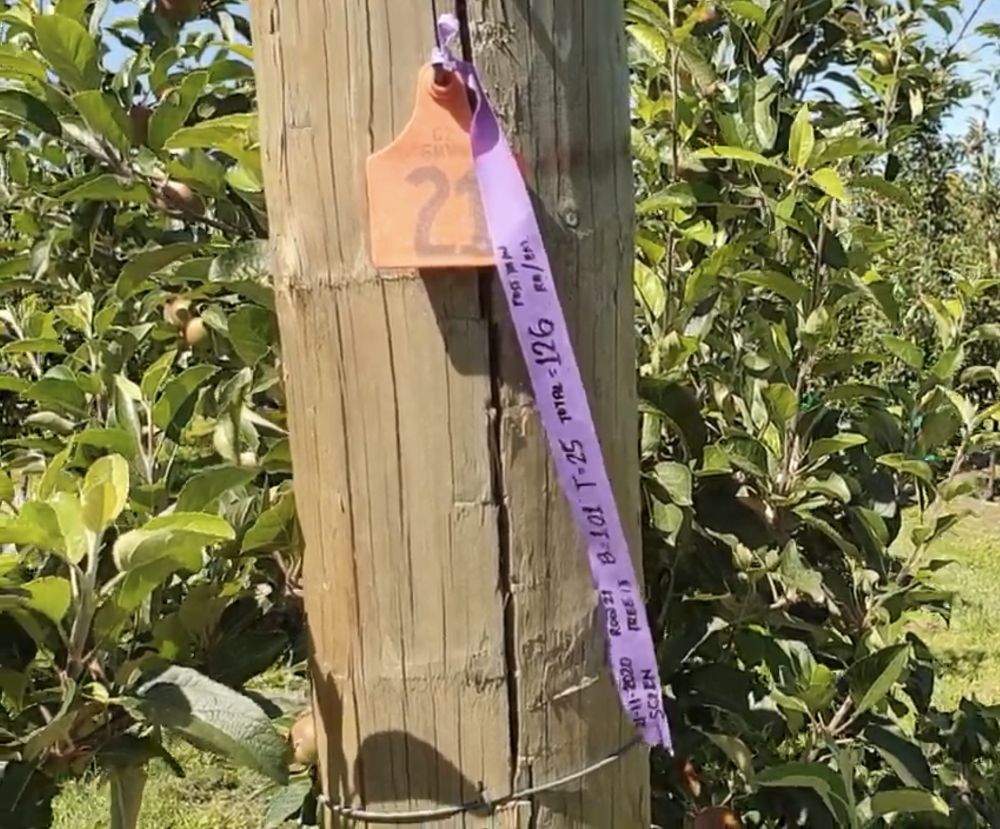
- Subjectivity & Human Error: Often, manual orchard measurements are subjective (e.g. a vigour rating, or bloom percentage). Different scouts may perceive tree properties differently, introducing errors into the dataset that can obscure the trial's actual efficacy and muddy the conclusions.
- Cost Prohibitive Labor: Collecting per-tree metrics (fruit size, count, and canopy volume) manually across multiple replicates is incredibly expensive and slow, often making large-scale commercial trials financially impossible.
High-Speed, Non-Subjective Data Acquisition
Your digital researcher!
Green Atlas Cartographer acts as an automated ‘digital researcher’, capable of auditing every tree in a trial plot with total objectivity and high-speed repeatability.
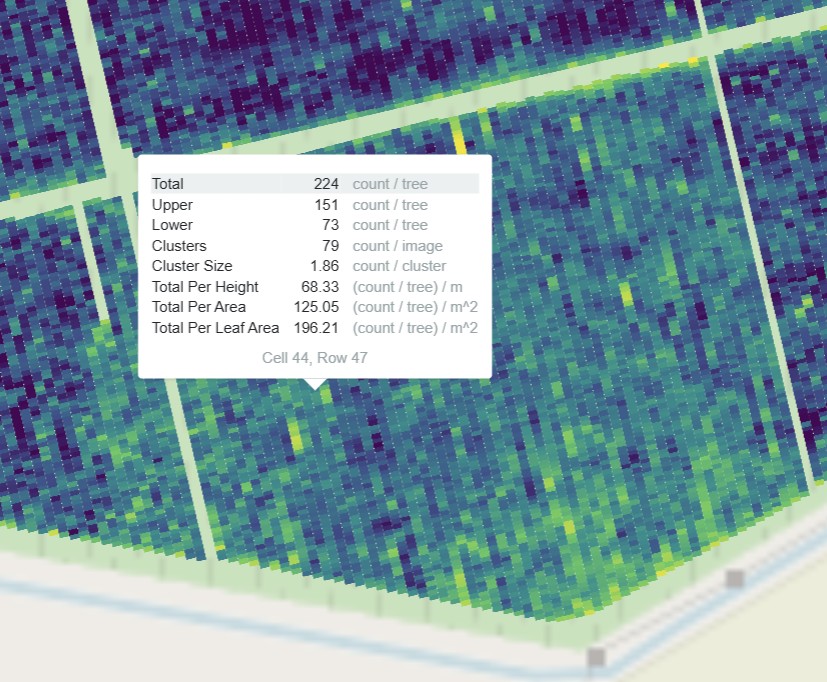
- Multi-Layered Feature Extraction: The system doesn't just look at one metric; it simultaneously captures bud/flower/fruit counts (together with properties such as colour and size) and 3D canopy geometry (height, density, leaf-area). This allows researchers to see how an input affects both yield and structural growth.
- Standardised Measurement: Because the camera image processing and LiDAR sensors apply the exact same logic to every tree, the data is entirely non-subjective. This creates a level playing field for comparing treated vs. untreated rows or areas.
- High-Frequency Monitoring: Because the scan is so fast (>20km/h in narrow row spacings), researchers can scan the same trial plot weekly or bi-weekly to monitor the rate of change; capturing the exact moment a treatment begins to show results and its evolution over time.
Rapid, Scalable, and Defensible Evaluation
Cause and effect; at scale.
The result is a paradigm shift in how agricultural trials are designed and analysed. Research outcomes shift from anecdotal to statistically valid.
- Increased Statistical Power: By moving from a sample of a small number of trees to a census of every tree in the trial, the statistical power of the trial increases. Small but significant improvements that could be lost in low-frequency, low-replicate manual sampling become clearly visible.
- Accelerated Trial Turnaround: For chemical or nutrient companies, being able to rapidly prove efficacy of new products across diverse commercial environments potentially means faster product iteration.
- Holistic Plant Response: Researchers can correlate different data layers. For example, measuring the primary response of a trial on fruit count, while also assessing secondary effects such as changes in biomass or foliage provides a more nuanced and holistic view of the plant’s response to the trial.
Field Trial Example Use-Cases
How researchers are using Cartographer to understand orchard behaviour.
Chemical Efficacy Trials
Apply a new thinning agent to specific rows and use the Cartographer to compare the post-bloom fruitlet counts against the control rows. Provides an exact percentage of ‘thinning success’ across the entire block, rather than a rough estimate. Large scale measurement allows large scale application; more representative commercial equipment can be used for spray, rather than manual applications using backpack sprayers.
Varietal and Rootstock Comparisons
Map tree growth via geometry measurement (height/volume/leaf-area) and yield of new varieties. Directly quantifies which rootstock or variety is more ‘precocious’ (early bearing) or vigorous in specific soil conditions.
Irrigation and Nutrition Trials
Monitor canopy density and leaf-area in response to different fertigation or spreading regimes. Pinpoints the exact tipping point where increased water or nitrogen stops providing a marginal gain in biomass or fruit count.
Get Started
Plan your trials with confidence.
Find your nearest Green Atlas service provider to discuss how Cartographer can improve your field trial outcomes.