Fruit Size
At a Glance
| Challenge | Obtaining an early, accurate estimate of fruit size distribution and fruit growth rate is impossible to do at orchard scale with conventional manual tools. |
|---|---|
| Solution | Green Atlas Cartographer enables rapid objective and repeatable fruit size assessment at scale, sampling fruit from the entire orchard. |
| Result | Accurate assessment of average fruit size, fruit size distribution and fruit growth rate enabling numerous forward planning activities such as optimum harvest timing, packout estimation, future packaging requirements and the development of sophisticated growth curves. |
| Applicable Crops | All crops and stages. |
The Manual Sampling Bottleneck
Manual sampling is costly and often subjective.
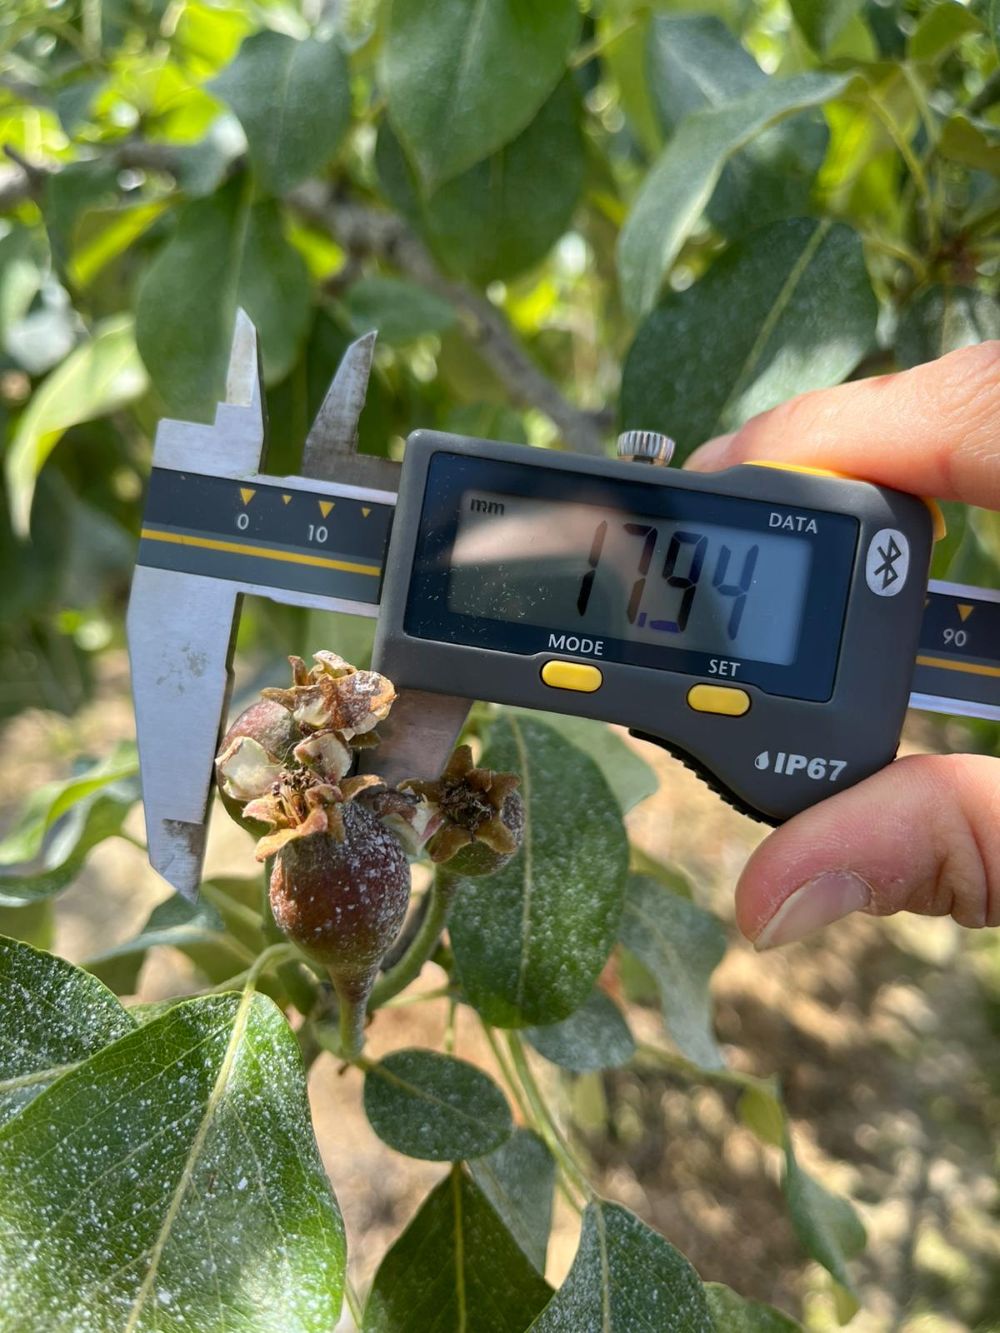
Relying on hand-calipers (including digital connected variants) or dendrometers to track fruit growth has serious shortcomings when applied to commercial orchards:
- Statistically Insignificant Data: Humans or dendrometers will typically sample only a fraction of a percent of an orchard’s fruit. This tiny sample size fails to capture the true size distribution of the crop.
- The Eye-Level Bias: Humans naturally tend to pick the most accessible fruit to measure. This has the effect of de-randomising the sampling strategy, also leading to an inaccurate overall average and distribution.
- Labor Intensity: Measuring fruit on a regular schedule to establish a growth curve is expensive and slow.
Automated Vision-LiDAR Sizing
Rapid, repeatable, ubiquitous sampling
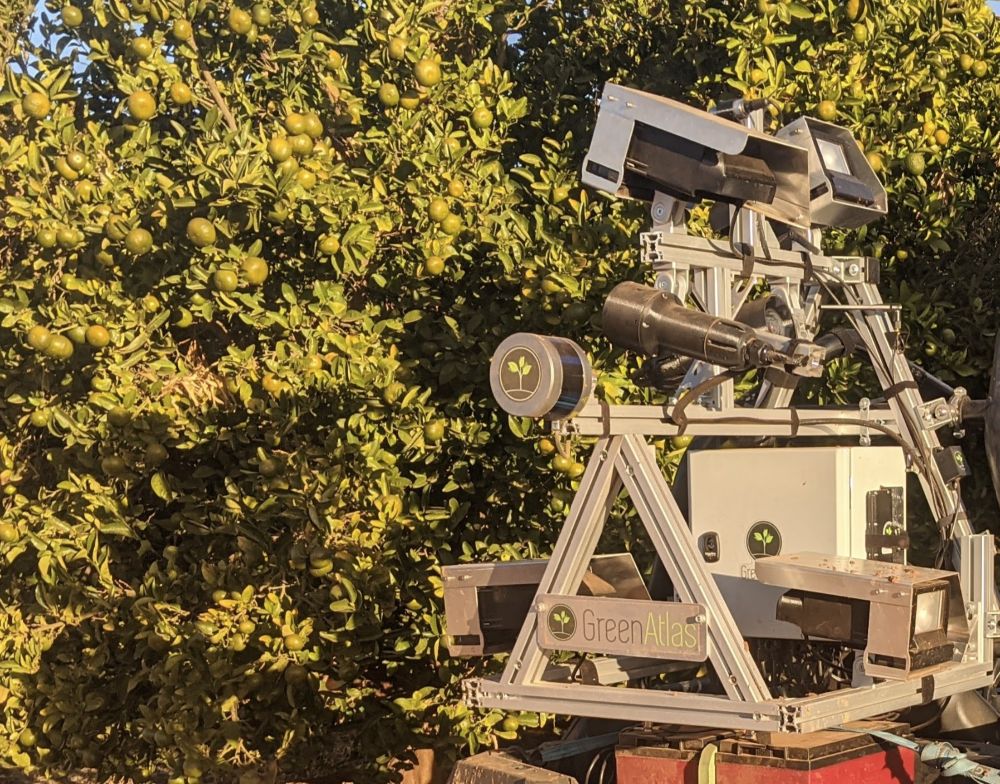
Green Atlas Cartographer uses high-resolution imaging, automated fruit extraction algorithms and LiDAR to measure the size of thousands of fruits in an orchard block.
- Representative Sample Sizes: By scanning every tree in every row, the system measures a statistically large percentage of the total crop. This provides a significantly better representation of fruit sizes across the entire block than manual sampling is able to achieve.
- Repeatable Growth Snapshots: Because the scan is rapid, growers can scan the same block at regular intervals. This creates a high-resolution data set that tracks exactly how many millimeters the fruit is gaining per week.
- Spatial Size Mapping: The system doesn't just give an average; it shows where the small and large fruit are located. This allows agronomists to correlate fruit size with fruit load, soil types, irrigation zones, or canopy density.
Strategic Forward-Planning and Logistics
Know more. Plan ahead.
Having an accurate digital inventory of fruit sizes weeks before harvest allows for a level of operational sophistication that manual sampling simply cannot match:
- Detailed Growth Curves: By combining current size data with historical trends and weather forecasts, a grower can predict the final harvest size with high confidence, allowing for early market commitments.
- Optimized Harvest Timing: If growth curves show the fruit is sizing up faster than expected, harvest can be brought forward to prevent the fruit from becoming too large for premium retail specifications.
- Precision Packout Estimation: Growers can predict how many fruits will fall into each size category (e.g., 60mm vs. 70mm). This can be used to inform the packing shed in advance, ensuring they have the correct labels, trays, and boxes ready.
- Targeted Thinning, Nutrition and Irrigation: If mid-season data shows a block is undersized, managers can intervene with late-stage thinning, nutritional boosts or irrigation changes to push the fruit into the desired size bracket before the opportunity for remediation closes.
Examples of Fruit Sizing Data in Action
How fruit size data enhances orchard efficiency and profitability.
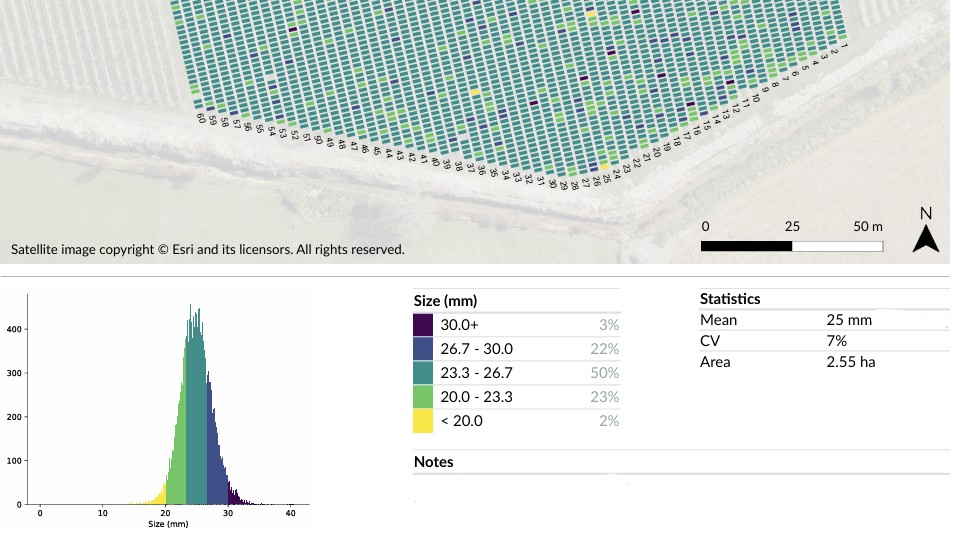
The Bell-Curve Analysis
A histogram showing the percentage of the crop in each size category. Instead of knowing only that the average is 70mm, the complete picture further shows that 20% of the crop is currently too small for the target market, triggering an orchard management change.
Predictive Growth Tracking
Compare a scan from say January 1st to January 15th. "The crop gained 4mm in two weeks. At this rate, we will hit the target size on March 10th, five days earlier than the historical average, so we will schedule the harvest date accordingly."
Packaging & Storage Logistics
Send the Size Distribution Report to the procurement team. They can then order the exact ratio of 18kg cartons versus 12kg based on the predicted fruit number and dimensions, reducing waste and storage costs.
Get Started
Know your fruit size distribution and growth.
Find your nearest Green Atlas service provider to discuss how Cartographer fruit sizing can improve your orchard's efficiency.